Arctic Sea Ice
Sea Ice Brief for the Central Arctic Ocean (Fall 2024)
Dramatic changes to the Arctic Ocean in recent decades, first observed along coastlines, have reached even the Central Arctic Ocean (CAO) surrounding the North Pole, where satellites first began measurements of ice in the 1980s.
The Central Arctic Ocean encompasses 2.8 million square kilometers (1.1 million square miles) of “high seas,” defined by international law as waters at least 200 nautical miles from the nearest coast. To protect this region as melting ice allows increasing access, 10 countries recently concluded a binding international agreement to prevent the start of commercial fishing until at least 2037. The loss of sea ice also opens the region to the risks associated with commercial shipping and deep-sea mining. Ocean Conservancy is working to address these threats to the region’s ecosystems and communities.
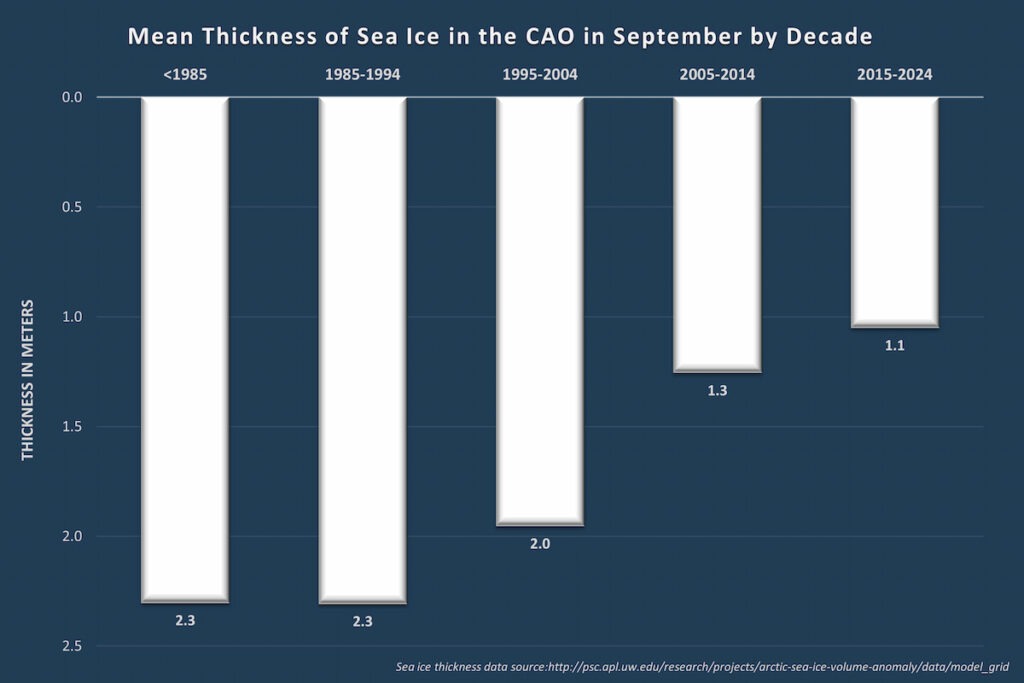
Sea Ice Thickness
Up until the early 2000s, the Central Arctic Ocean was largely covered by ice throughout the year. Because the ice persisted through the summers, it grew thicker the following winter, creating large contiguous areas of multi-year ice. This old ice was strong and resilient, making it very difficult for ships to reach the waters around the North Pole. Only the strongest icebreakers were up to the task.
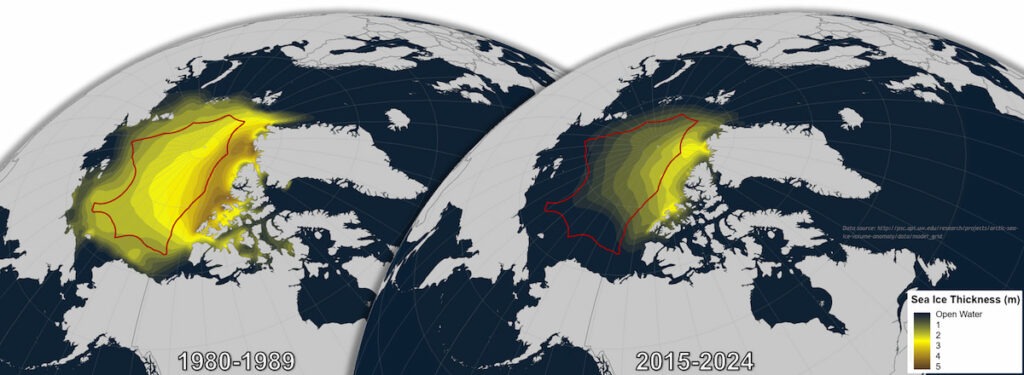
In the first decade of satellite measurement in the 1980s, ice thickness in the Central Arctic Ocean in September, the time of minimum ice extent, measured an average of 2.3 meters (7.75 feet). By 2015-2024, this same average has decreased by 52%. In the past five years, the mean thickness has dropped to less than a meter. The thinner ice cap includes far less multi-year ice, and is more susceptible to further disruption. Strong winds can open vast areas of open water, and warmer weather and seawater can melt far more of today’s fragile ice than would have been possible only a couple of decades ago. As a result, Arctic sea ice is no longer resilient.
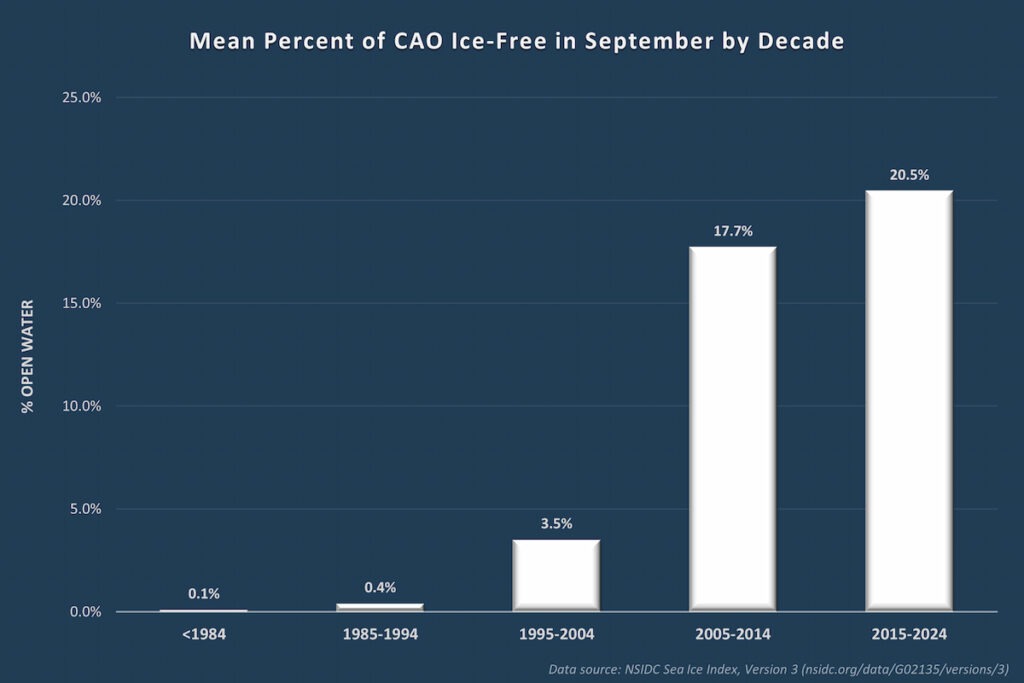
Sea Ice Extent
Persistent sea ice over the Central Arctic Ocean made the region inaccessible to ships until the strongest icebreakers were built in the 20th century. But since 2000, more and more open water is appearing in summer months.
Each September throughout the 1980s, the time when sea ice reaches its annual minimum, an average of less than 1% of this high-seas region was open water (defined as having less than 15% ice cover). For the decade from 2015-2024, this figure soared to an average of more than 20%.
The single-year high for open water in the Central Arctic Ocean so far is 42%, in 2012. Most of the open water is on the Pacific side of the Arctic Ocean over the relatively shallow fishable waters of the Chukchi Cap which lies north of the Bering Strait off of Alaska and eastern Russia. Without sea ice, fishing vessels can access this area. And all Arctic sea ice models predict further declines in summer extent, so the percentage of open water is expected to increase.
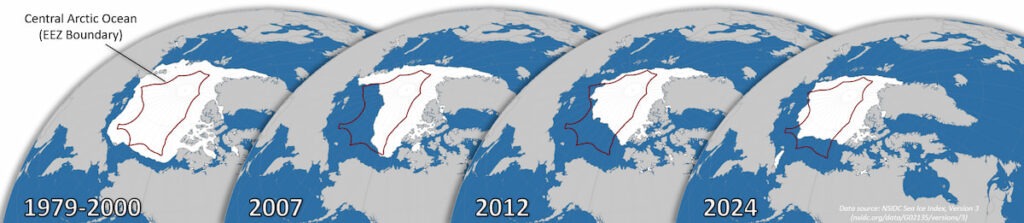
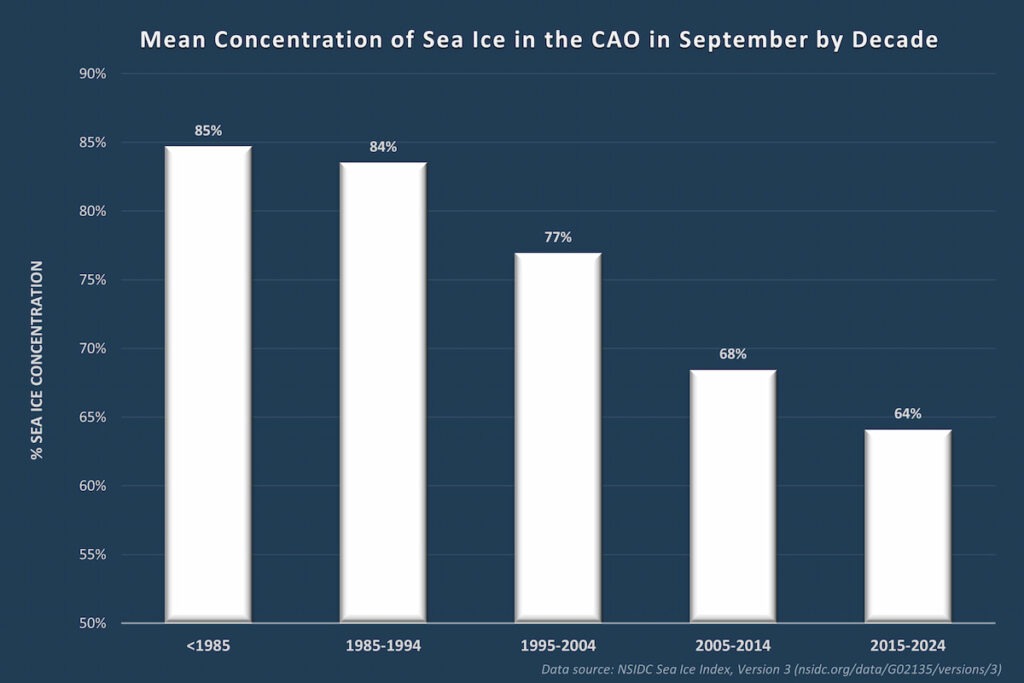
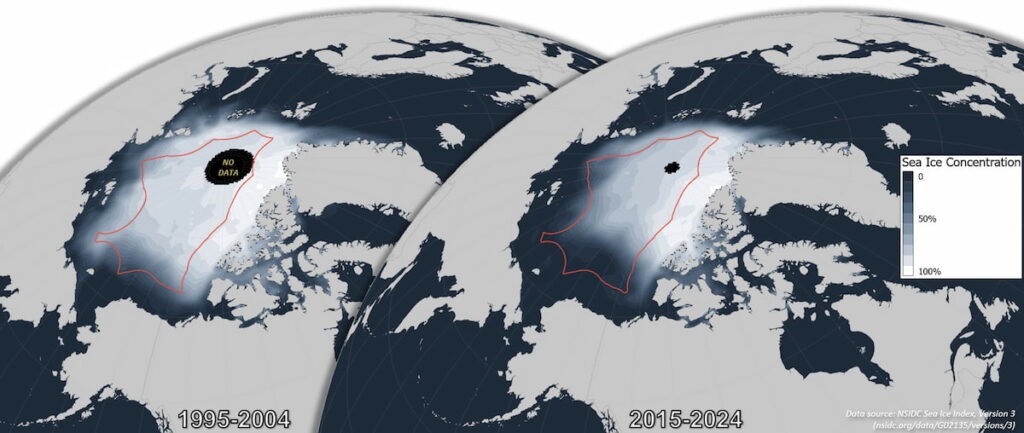
Sea Ice Concentration
Not only is sea ice thinner and less extensive in summer, the concentration is also declining. Sea ice extent measures the overall area with greater than 15% ice cover, whereas sea ice concentration examines how densely packed or dispersed sea ice is within a given area. Thus, the area covered with sea ice is both smaller in size and contains less ice than formerly. As with thin ice, areas with low ice concentration are more susceptible to the ice being pushed aside by wind or melted by warmer water or air. As maps of the Central Arctic Ocean show, robust ice cover has all but vanished. The general downward trend is expected to continue, and the ice that remains may also suffer from catastrophic disruption, much as happened in the record-setting year of 2012.
The Implications of Sea Ice Loss
The decline in ice thickness, extent, and concentration is a triple whammy. As a result, the Central Arctic marine ecosystem is already seeing an ecological transformation affecting everything that lives there. The prospect of increased human activity adds yet more stress to an already uncertain future. The Central Arctic Ocean Fisheries Agreement of 2018, which banned commercial fishing of much of the Arctic, set an important precedent for choosing caution over exploitation. Ocean Conservancy is working to protect the Central Arctic Ocean from additional threats such as shipping and deep-sea mining.
Data sources:
-
- Sea ice extent and concentration: Sea Ice Index. (G02135, Version 3). Monthly Extent and Concentration Data. Boulder, Colorado USA. National Snow and Ice Data Center.